The commercial trucking industry plays a vital role in the global economy, facilitating logistics, transportation, and various sectors’ needs. Understanding how many commercial trucks are currently on the road is crucial for trucking company owners, fleet managers, and procurement teams within construction and mining enterprises. This article provides a detailed examination of the global commercial truck fleet, including an overview of current estimates, regional breakdowns, influences shaping the market, and future projections. As we delve into each chapter, we will uncover the dynamics affecting the number of commercial trucks operating today, offering actionable insights for stakeholders.
Counting the Miles Driven: A Deep Dive into How Many Commercial Trucks Roar Across Global Roads Today

The question of how many commercial trucks are on the road today sounds simple, but it sits on a moving target made up of registrations, renewals, retirements, and the relentless churn of daily operations. Fleet counts rise and fall with economic cycles, infrastructure programs, and changing regulatory regimes. Rather than offering a single, real-time census, researchers piece together a reliable portrait from multiple data sources, each with its own scope and definition. The result is a layered understanding: a global fleet that includes many kinds of commercial vehicles, from small delivery vans to heavy-duty tractors, and a subset of those that actually carry freight and personnel along the world’s highways every day. In that sense, the numbers aren’t a single dial you turn; they are a composite score drawn from registrations, utilization, and market dynamics that shape how trucks are deployed now and how they will be in the years ahead.
On a global scale, the recent industry synthesis paints a broad, context-rich picture. As of 2024, the global footprint of commercial vehicles—encompassing trucks, buses, delivery vans, and other freight-carrying machines—stood at about 50 million units in operation. A substantial portion of this stock comprises light and medium-duty vehicles that populate urban deliveries and regional hauls, yet a meaningful and growing share is devoted to heavier, long-haul work that keeps supply chains moving. Within this mix, heavy-duty trucks, defined here as having a gross vehicle weight rating over 15 tons, are estimated to number upward of 32 million worldwide. Those are the vessels most visible in cross-border corridors and major freight corridors, where the heaviest loads ride on the strongest frames.
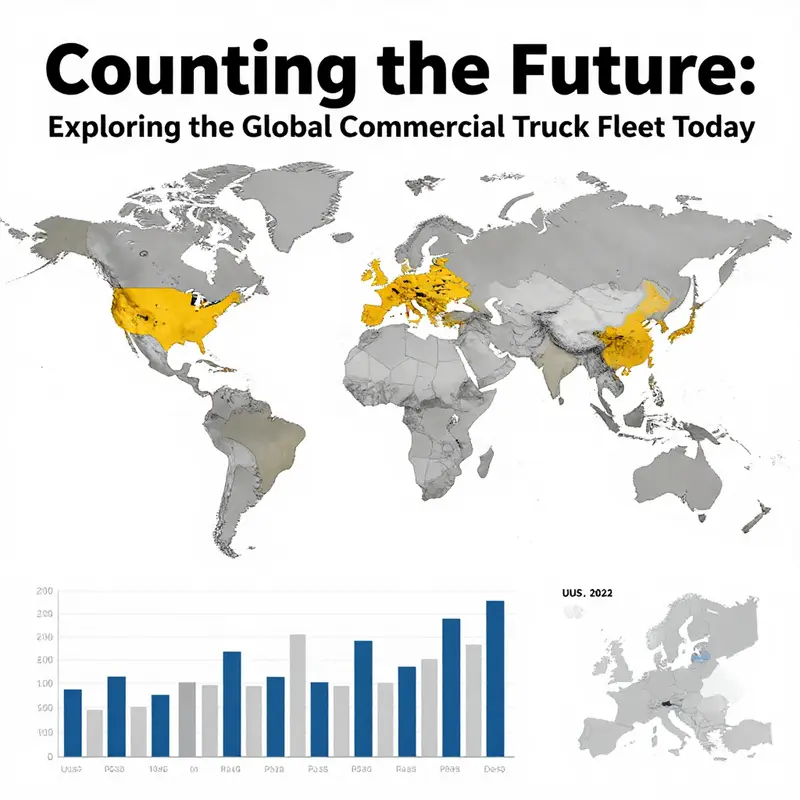
Regionally, the United States accounts for a large chunk of the global heavy-duty and broader commercial-truck fleet. In 2024, the U.S. alone is reported to have about 14 million commercial trucks registered. This figure underscores the scale of North American freight movement, where fleets operate across a landscape of cross-dock hubs, intermodal terminals, and long-haul routes that knit together manufacturing regions with retail and consumer destinations. In parallel, China’s market has continued to expand, with commercial-truck fleets exceeding 20 million units by the end of 2024. That growth reflects a combination of rapid urbanization, manufacturing scale, and the persistent demand for goods movement that accompanies the country’s economic dynamics.
A useful way to frame these numbers is to distinguish the stock of vehicles on the road from the subset actively used for heavy freight. North America alone, according to S&P Global Mobility (formerly IHS Markit), was home to roughly 32 million commercial vehicles operating on roads in 2024. That total includes not just heavy-duty trucks but a broader mix of delivery vans, buses, and various specialized vehicles that keep commerce and public services moving. When the conversation centers on heavy-duty trucks specifically, the global count of more than 32 million signals a remarkably large and interconnected logistics ecosystem rather than a single, uniform fleet category.
To place these figures in a broader historical frame, industry assessments have long cited the scale of the global commercial-vehicle stock, noting that when you include all kinds of freight- and passenger-carrying vehicles, the global fleet sits in the vicinity of 1.2 billion units. That figure, derived from a 2018 global assessment cited by market researchers and industry analyses, provides context for the sheer size of the commercial-vehicle market. It also clarifies why even substantial percentage changes in specific segments—such as heavy-duty trucks or autonomous freight vehicles—translate into meaningful shifts in overall transportation capacity and emissions profiles.
This guidance on counting is essential because the real-time tally is not public in one authoritative number. The fleet is constantly in flux: trucks enter service as new models roll off production lines, are deployed into fleets after registration, cycle through maintenance, and eventually exit service through scrappage or repurposing. Each data provider solves for a different slice of the puzzle. The practical upshot is that the most credible estimates cluster around a relatively wide band rather than around a pinpoint value. They describe a world where, at any given moment, tens of millions of heavy-duty and lighter commercial vehicles are actively contributing to the movement of goods, with the heavy-duty segment acting as the backbone for long-haul, cross-border, and regional freight.
The picture becomes more nuanced when we add the frontier of autonomy. Autonomous or self-driving trucks—still a small yet increasingly visible segment of the market—illustrate how a portion of the existing fleet could be reimagined in the years ahead. By late 2025, Global Data reported that the number of globally operated autonomous transport trucks rose from about 2,080 in July 2024 to 3,832 in July 2025. These deployments have tended to occur in controlled environments, such as logistics hubs and designated freight corridors, where safety and efficiency gains can be demonstrated before broader market adoption. The evolution of autonomous freight carries implications not just for headcount and utilization, but for how the overall road-traffic system is planned, funded, and regulated. It also highlights the dynamic tension between fleet growth and the need to manage congestion, emissions, and energy use as fleets transform.
All told, the most credible synthesis from 2024 through 2025 suggests a few core takeaways. First, the North American fleet remains a robust, high-volume fleet—well over 30 million commercial vehicles on the road within the region, with heavy-duty trucks accounting for a significant share of that activity. Second, the global landscape continues to be dominated by very large markets in North America, China, and Europe, each contributing to the overall scale of the heavy-truck fleet while reflecting distinct regulatory, economic, and logistical realities. Third, the global fleet of all commercial vehicles is enormous, with stock-level estimates widely cited around 1.2 billion units when considered in a broad, inventory sense. And fourth, a small but growing fraction of trucks is advancing into autonomy, offering new capabilities and new questions about safety, efficiency, and infrastructure needs.
The numbers matter beyond academic curiosity. They inform decisions about highway design, maintenance budgets, fuel and emission policies, and the pace at which trucking markets can absorb new technologies. They shape the demand for spare parts, maintenance services, and used-truck markets, all of which hinge on the typical life cycle of a commercial vehicle and the dynamics of new-vehicle supply. For fleet operators and policy makers, the challenge is to read these indicators together: a rising stock of heavy-duty trucks, a steady cadence of new registrations, and an emerging technology layer that could alter utilization patterns even before the next generation of engines and transmissions becomes standard across fleets. In this sense, the question “how many commercial trucks are on the road today?” becomes a prompt to think about how freight flows are organized, funded, and governed across different regions and over time.
In the spirit of practical navigation through this data, it helps to anchor the discussion with a usable cross-section. A glance at the North American scene—where a large and diverse fleet coexists with intricate supply chains—offers a tangible reference point. The sheer scale of approximately 32 million commercial vehicles on North American roads in 2024 reflects a mature, high-activity market with extensive interdependencies among manufacturers, logistics providers, and retail networks. When you add China’s more than 20 million heavy-duty trucks in 2024 and Europe’s substantial but varied fleet, the global highway system reveals itself as an immense, distributed machine composed of millions of moving parts that must be synchronized to keep trade flowing smoothly.
Within this narrative, it is also instructive to recognize the diversity of what “commercial truck” covers. The global fleet includes a spectrum from light delivery vans that transport parcels in city streets to heavy tractors hauling intercontinental freight. Different regions weigh these categories differently, reflecting urban density, road quality, labor costs, and policy choices. As a result, even though the headline numbers for heavy-duty trucks are striking—tens of millions worldwide—the operational reality on any particular road depends on the local mix of vehicles, the time of day, and the specific freight corridors that dominate a given region.
For readers seeking a deeper dive into regional patterns and market dynamics, a narrative thread can be drawn toward the used-truck market and price stability. As fleets turnover, used-truck prices become a key indicator of fleet health, financing costs, and the pace at which operators adopt newer technologies. An accessible entry point for readers who want to connect these concepts with market realities is to explore studies that examine used-truck price trends and their drivers. These analyses illuminate how fleets balance the cost of new equipment against the depreciation and reliability profiles of older assets. You can explore this topic further here: Used Truck Prices Stability Insights (2025).
The broader context also invites readers to consult global energy and efficiency perspectives, where the transportation sector’s footprint is managed through a combination of technology, fuel choices, and policy incentives. For a more expansive view of global energy considerations and freight trends, external reference material from established energy policy bodies helps frame where the trucking sector sits in the wider energy transition. See the International Energy Agency’s current analyses for a comprehensive view of freight and emissions trends that shape and are shaped by the size of the truck fleet. External reference: https://iea.org.
In sum, while there is no single, real-time tally that captures every commercial truck on every road at every moment, the convergence of credible estimates points to a world where the total number of commercial vehicles sits in the vicinity of several hundred million, with heavy-duty trucks alone numbering in the tens of millions. The North American region, supported by recent mobility studies, represents a large and highly active component of that total, while the global stock figure—roughly 1.2 billion commercial vehicles when considered as inventory—highlights the scale and complexity of the freight ecosystem that underpins modern economies. The road ahead will likely see continued growth in total vehicle stock, ongoing fleet renewal, and a cautious exploration of autonomous operation in controlled environments, all within the broader context of efficiency demands, emissions goals, and the relentless push to move goods faster, cleaner, and more reliably.
As the data landscape evolves, so too does the narrative around what these counts mean for regional planning, corporate strategy, and public policy. The road network is, in essence, a living ledger of trade and movement, and each number about trucks on the road is a line in that ledger. From the corridors that link manufacturing hubs to the stores where goods are consumed, to the yards where tractors are serviced and repurposed, the fleet size is a proxy for the scale of modern commerce. And as fleets continue to adapt—whether through deregulation, new financing models, or the emergence of autonomous pilots—the story of how many trucks are on the road today will keep evolving in step with the world they serve.
The Global Truck Fleet in Motion: Regional Realities, Growth, and the Elusive Count
Counting the global footprint of commercial trucks on the road today is a deceptively simple question that resists a single, static answer. Fleets swell and shrink with daily operations, regulatory shifts, and the rhythms of trade and consumption. The best available synthesis from industry sources paints a broad, dynamic picture: in 2024 the world carried roughly 50 million commercial vehicles in operation, a category that spans the friendly gray area between delivery vans and heavy-duty haulers, buses, and specialized trucks. Within that broader category, heavy-duty trucks—defined here as those with a gross vehicle weight of more than 15 tons—are estimated at more than 32 million units globally. Those two figures foreground a simple truth: trucks are not a single, countable line item but a fleet in motion, a mosaic shaped by region, vehicle class, and the economic pulse of the world. Yet even as numbers accumulate, the precise count of trucks on any given day remains elusive, a moving target anchored to the same forces that drive logistics itself: capacity, demand, and the frictions of regulation and technology. For researchers and fleet managers alike, the challenge is less one of finding a single number and more about understanding the regional patterns that underwrite the global total and the trends that push the fleet upward year after year.
The regional distribution of trucks is where the narrative becomes more concrete, even as totals stay broad. In North America, the trucking sector remains robust, buoyed by a steady drumbeat of e-commerce and renewed infrastructure investments. A mature market with a long history of freight movement, the region supports a substantial contingent of heavy-duty trucks and a parallel cadre of medium- and light-duty vehicles used in everything from local distribution to long-haul manufacturing networks. Europe presents a slightly different snapshot. Here, there is a higher concentration of medium- and light-duty commercial vehicles, which aligns with dense urban corridors, stringent emissions regimes, and policy incentives aimed at cleaner, more efficient fleets. The regulatory environment in Europe accelerates changes in vehicle technology and fuel choices, guiding operators toward newer, lower-emission equipment and smarter maintenance regimes. The Asia-Pacific region, however, dominates the growth story in contemporary terms. China and India—two of the world’s most populous economies—are advancing rapidly in both road-building and industrial output, and the resulting surge in urbanization and freight activity has driven a pronounced uptick in commercial vehicle numbers. In this region, the sheer scale of activity makes even small percentage gains in fleet density translate into tens of thousands more trucks on the road, year after year.
To understand these regional dynamics, one can start with the observable consequences of growth: more trips, longer miles, and evolving fleet profiles. In North America, fleets tend to be asset-heavy, with a high reliance on long-haul operations supported by sophisticated telematics and integrated maintenance planning. The emphasis here is on reliability and uptime, practices that keep a large fleet moving through harsh weather, congested corridors, and the complex toll and regulatory environments that come with cross-border movements. In Europe, the emphasis shifts toward efficiency and compliance. The fleet mix often includes more modern, cleaner powertrains and a faster turnover of vehicles to meet stringent emissions standards. Fleet managers here juggle regulatory demands with city-center access constraints, making route planning, idle-reduction strategies, and multi-modal interchange crucial parts of daily operations. In Asia-Pacific, the mix is more varied and rapidly evolving. Large-scale manufacturing bases, expanding logistics networks, and the growth of e-commerce supply chains push fleets toward both high-capacity long-haul solutions and agile urban delivery formats. The consequence is a continental tapestry of vehicle types, road conditions, and regulatory atmospheres that together shape how many trucks are needed, how they are used, and how they are maintained.
When the question turns from regional tendencies to the number itself, the best available estimates become especially important. The global count sketched by recent industry studies places the total of all commercial vehicles at roughly 50 million in operation as of 2024, with heavy-duty trucks alone topping 32 million. There is, however, a subtle discrepancy to acknowledge. Some industry snapshots describe the broader commercial vehicle category as hovering around 50 million, while others point to a total fleet of just over 30 million trucks when focusing strictly on truck transactions and registrations. In practical terms, what this means is that the precise inventory on the road at any exact moment cannot be locked in to a single figure. The fleet is in constant motion: new registrations occur as fleets expand or replace aging equipment; vehicles move between regions to support evolving supply chains; and some assets exit service due to retirement, scrappage programs, or repurposing. The result is a continuous ebb and flow that renders a fixed “today’s count” both impractical and, in a real sense, unnecessary for understanding the business landscape. What matters more is direction, scale, and mix—how many trucks in a given region, what types are predominant, and how these factors shift with the global economy.
For those seeking to gauge the regional mix with a practical lens, the numbers are best interpreted through the lens of supply chain dynamics and policy environments. In North America, truck populations are influenced by ongoing infrastructure investments and a resilient consumer economy that sustains freight volumes across core corridors. The regional fleet remains relatively stable in terms of composition, with heavy-duty tractor-trailer units forming the backbone of long-haul logistics and local and regional distributors relying on a spectrum of medium- and light-duty vehicles. In Europe, the emphasis on emissions compliance and efficiency translates into a faster turnover of equipment and greater adoption of cleaner technologies, even as fiscal and regulatory constraints push fleets toward newer assets that can meet more stringent standards. Asia-Pacific markets show the most pronounced rate of change. The sheer scale of freight throughput, combined with urbanization and rising e-commerce, nurtures a rapid expansion of the fleet but also a more dynamic mix. In megacities and industrial corridors, you see a growing prominence of smaller, agile delivery vehicles designed for urban environments, while long-haul routes continue to rely on larger, more capable trucks. Taken together, these patterns reveal a world where the global truck fleet is not only large but also deeply shaped by regional priorities and the regulatory engines that steer fleet modernization.
The practical implications of this evolving fleet are felt in every tier of the supply chain. For fleet operators, the number of trucks on the road translates into capacity decisions, maintenance planning, and labor needs. It also drives questions about fuel efficiency, uptime, and the environmental footprint of freight transport. In an era of heightened scrutiny over emissions and energy use, operators and policymakers alike are focused on how to balance demand with cleaner, more efficient operations. This is where the broader ecosystem of fleet-management services comes into play, offering tools for fuel management, route optimization, maintenance scheduling, and compliance support. These services help fleets manage the day-to-day realities of a large, dispersed, and constantly shifting asset base. They provide the connective tissue that keeps the millions of trucks moving, ensuring that each mile traveled is counted not just in tonnage but in reliability and efficiency.
The data landscape behind these counts matters as well. Analysts draw on a constellation of sources to build the most credible pictures possible. Market researchers and industry intelligence firms track production and registrations, while national authorities—such as the United States’ transportation safety agency, Europe’s statistical offices, and China’s information technology ministries—provide official baselines for vehicle registrations. The International Energy Agency and organizations focused on mobility analytics contribute broader context about how fuel choices, regulatory regimes, and infrastructure investments shape fleet evolution over time. Even though the current moment cannot be locked into a precise, universally accepted tally, these sources collectively offer a coherent narrative: global truck fleets are sizable, regional distributions are uneven, and the trend lines point toward continued growth as trade expands and urban systems adapt to shifting demand and new technologies. For readers tracing the arc of how many commercial trucks are on the road today, the takeaway is not a single number but a map of movement—the regional pulse that underwrites the global totals, the vehicle mix that reflects local needs, and the forward-looking signals about how policy, technology, and consumer behavior will steer the next chapters of freight mobility.
To anchor this regional view in ongoing research, it is useful to explore how markets handle the uncertainties that come with rapid change. North American trucking, for instance, is grappling with fluctuations in freight demand, labor availability, and capital costs, all of which reverberate through fleet planning and capacity deployment. A recent synthesis of practice and outlook highlights the need for flexible, data-driven strategies that can respond to these shifts without sacrificing reliability. A good way to deepen understanding of these regional dynamics is to consult analyses that specifically address the Canadian and U.S. trucking markets under conditions of economic uncertainty. This kind of regional lens helps translate the broad global numbers into actionable insights for operators operating in today’s complex environment. For more on these North American dynamics, see Navigating economic uncertainties in North American trucking markets.
On the broader horizon, the global fleet landscape remains a barometer for trade health, technology adoption, and regulatory ambition. As e-commerce continues to push goods movement closer to consumers and as urban centers demand cleaner, more efficient freight solutions, the truck fleet will continue to grow in numbers, even as the structure of ownership, the age profile of equipment, and the mix of vehicle types evolve. That evolution will shape everything from maintenance cycles and fuel use to the design of pay-for-performance fleets and the deployment of alternative powertrains. The exact count on a given day may forever elude capture, but the direction is clear: more trucks on the road, smarter fleets behind them, and a logistics system that depends on counting not just the total, but the right totals—the right mix for regional needs, for regulatory realities, and for a future where freight moves more efficiently and with lower environmental impact.
External resource: https://www.statista.com/statistics/1354968/global-commercial-vehicle-production/
null
null
Counting the Rolling Fleet: Global Trends, Regional Realities, and the Uncertain Total of Commercial Trucks on the Road

The question of how many commercial trucks are actually on the road today reads more like a moving target than a fixed tally. Real-time counts are elusive because fleets turn over, regimes of data update at different cadences, and definitions vary by jurisdiction and by what counts as a commercial vehicle. Yet the best available figures, drawn from leading industry analyses and national statistics, sketch a coherent picture of a vast, globally dispersed, ever-changing fleet. As of 2024, the most widely cited global snapshot placed total commercial vehicles in operation at roughly 50 million when you include light, medium, and heavy trucks alongside delivery vans, buses, and specialized service vehicles. Within that broader category, heavy-duty trucks—vehicles with a gross vehicle weight rating over 15 tons—are estimated to number more than 32 million worldwide. The United States, with its large footprint and highly formalized registration system, registered about 14 million commercial trucks in 2024. China, meanwhile, exceeded 20 million in commercial truck stock by the end of that year, underscoring how the Asian market dominates much of the global tonnage dedicated to freight movement. These figures, which come from annual reports and market studies by S&P Global Mobility, FTR Transportation Intelligence, and the International Energy Agency (IEA), illustrate both a broad scale and some important caveats. They are not a live census; they are informed estimates that reflect current conditions, recent growth, and the evolving mix of vehicle types across regions. The global commercial truck fleet is therefore typically described as “over 30 million” in total heavy- and light-duty trucks and related freight vehicles, with a steady upward trajectory driven by e-commerce expansion, infrastructure investment, and urbanization, even as individual markets diverge in pace and policy stance.
To understand this landscape, it helps to distinguish how counts are assembled and what they truly measure. Registration data capture how many vehicles have been assigned plate numbers or operating permits. Operational data, by contrast, track vehicles that are actively used in commerce on a given day. The former tends to be higher because it includes non-operational vehicles as well as those awaiting retirement or sale. The latter fluctuates with daily freight patterns, maintenance cycles, and the ebb and flow of compliance checks. Add to this the nuance that some fleets define “commercial” differently—whether by weight, by whether the vehicle is used for business purposes, or by whether it is registered as a commercial entity versus a private carrier. The result is a spectrum of counts rather than a single, precise number. In practice, analysts rely on a blend of registrations, fleet activity indicators, and macroeconomic projections to craft a view that is both practical for planning and honest about its margins of error.
The regional distribution of trucks adds another layer of complexity. In North America, the United States represents a large, mature market with a well-understood fleet composition: a sizable base of heavy-duty trucks, many of them engaged in long-haul freight that binds the economy together across state lines and intermodal corridors. The ATA’s Freight Outlook for 2024-2026 highlights a stable cadence for U.S. heavy-duty registrations, projecting roughly 3.8 million heavy trucks in operation in the mid-2020s. This figure reflects steady fleet growth, supported by continued demand for freight movement, even as the industry navigates labor shortages and evolving fuel and technology standards. In China, the fleet is younger on average and configured to support a rapidly expanding manufacturing and e-commerce ecosystem. A stock exceeding 20 million trucks by 2024 mirrors a vast domestic logistics network and the country’s ongoing investments in freight corridors and urban distribution hubs. Europe, with its mix of dense urban centers and long-haul corridors, presents another pattern—high utilization, strong regulatory-driven modernization, and a shift toward efficiency and emissions controls that influence turnover rates and the timing of replacements.
These regional footprints matter because the total number of trucks on the road today is not merely a sum of worldwide registrations; it is an emergent property of regional dynamics—economic growth, fuel prices, fleet age, maintenance practices, and policy incentives. The global forecast from the IEA’s Global Transport Outlook, published in 2025, suggests that by 2026 the total global stock of commercial vehicles would approach about 320 million, with heavy-duty trucks accounting for well over two-fifths of that fleet. In practical terms, that implies roughly 2.2 hundred million commercial trucks worldwide when one considers the broader class of freight-carrying vehicles. The takeaway is not that the planet is suddenly brimming with more trucks than ever before, but that the commercial fleet is expanding in a structured, regionally uneven way. Asia, Africa, and Latin America are expected to account for a substantial portion of the growth, driven by urbanization, increased logistics activity, and a rising middle class that relies on door-to-door delivery and faster supply chains. These projections align with the long-run trend toward larger total freight volumes, even as the mix of vehicle types shifts with technology, constraints, and policy priorities.
The United States offers a focused lens on where counts are anchored and how they evolve. The 2024 Freight Outlook from the American Trucking Associations (ATA) points to a relatively steady trajectory for U.S. heavy-duty trucks through 2026, with registrations hovering around the 3.8 million mark. The stability of this figure amid broader global volatility reflects both the scale of American freight activity and regulatory and economic factors that influence fleet renewal and operator investment. In contrast, the global market is more sensitive to growth patterns in manufacturing, e-commerce, and international trade, as well as to the pace of fleet modernization in major markets. The IEA’s 2025 forecast emphasizes the resilience of freight demand in developing regions, where rapid urbanization creates formidable needs for efficient, robust trucking capacity even as fleets age and turnover cycles accelerate with policy and technology interventions. Taken together, these sources suggest a dual narrative: a large, steady core in mature markets like the United States and Europe, and a rapidly expanding, dynamically evolving frontier in growth markets where fleet growth outpaces older vehicle retirement for longer stretches.
Another lens to understand the total on the road is to consider the used-truck market as a barometer of fleet turnover. When carriers refresh their fleets, or when smaller operators adjust capacity in response to demand, the prices and availability of used trucks reflect that rhythm. Recent trends in used-truck sales growth illuminate how the fleet evolves without requiring a constant influx of new equipment. A sharp rise in available options, coupled with shifting financing conditions and residual values, can signal deeper changes in how many trucks are active within the fleet and how intensively they are deployed. For readers curious about how these dynamics play into the overall counts, a useful resource is the discussion of current trends in used-truck sales growth, which frames how fleet composition shifts as vehicles exit service and re-enter the market as pre-owned units. You can explore this perspective here: https://mcgrathtrucks.com/current-trends-in-used-truck-sales-growth/.
If we step back from the numbers, several drivers shape the near- to mid-term trajectory of the truck-on-road figure. E-commerce continues to push the demand for reliable, fast, and efficient delivery networks. This in turn sustains demand for both long-haul and regional trucking, supporting a growing but aging fleet in some regions and a newer, more productive mix in others. Infrastructure investment, particularly in corridor development and intermodal facilities, enhances the efficiency of the overall freight system and can influence how many trucks are operational at any given time by improving asset utilization and reducing congestion delays. Labor market conditions play a critical role as well; skill shortages can slow fleet renewal if carriers defer replacement or expansion due to financing constraints or uncertain demand. In this environment, technology and policy push are as consequential as macro demand. Electrification and other decarbonization pathways, for instance, can alter the calculus of total on-road trucks by changing the economics of ownership, maintenance, and turnover. As fleets adapt to new powertrains, telematics, and optimization software, the timing of retirements and the rate of new-truck purchases will reshape the longer arc of the fleet size curve even when gross freight volumes continue to grow.
For stakeholders across carriers, shippers, policymakers, and equipment suppliers, the central insight is not a single precise headcount but a robust framework for thinking about the road fleet. The headline numbers—about 50 million commercial vehicles globally in 2024, more than 32 million heavy-duty trucks, and roughly 2.2 hundred million heavy trucks forecast globally by 2026—provide essential benchmarks. They anchor planning for capacity and resilience, help frame policy discussions around emissions, safety, and highway efficiency, and inform investment decisions around maintenance, replacement, and the deployment of new technologies. Within this broader picture, the United States stands as a critical reference point for forecasting, given its size and the maturity of its data systems. Yet the story remains inherently regional and contingent on a suite of interacting factors, from supply chain reliability to energy prices and urban design. The precise total “on the road today” will always be a snapshot within a moving landscape, but the trajectory is clear: the rolling fleet continues to grow, modernize, and respond to the evolving demands of a global economy that moves ever more goods in tighter timeframes.
As the sector navigates this complexity, readers can turn to a mix of sources for deeper context and updated figures. The ATA’s Freight Outlook offers a US-focused forecast that helps ground expectations in domestic policy, economic conditions, and fleet renewal cycles. On the global side, the IEA’s Global Transport Outlook provides a macro-level view of where counts are headed in the coming decade, including regional patterns that shape both the pace and the geography of truck growth. Together, these resources illuminate a key point: while a precise, universal number for “today” remains out of reach, the combined data tell a coherent story of scale, movement, and continual evolution in the world of commercial trucking. The road is busy, the fleet is aging in some markets and renewing in others, and the total count emerges from the interaction of demand, policy, technology, and finance across a diverse and dynamic global system.
External resource for further reading: https://www.trucking.org/insights/reports/2024-freight-outlook
Final thoughts
In conclusion, the commercial truck fleet is a dynamic entity influenced by a myriad of factors that reflect broader economic trends and technological advancements. With over 50 million commercial vehicles in operation globally, the trucking industry is a critical underpinning of logistics and freight transport. Understanding regional distributions and the driving forces behind these numbers provides essential insights for stakeholders looking to navigate changes in market dynamics. As we look to the future, ongoing developments, particularly in technology and regulatory frameworks, will continue to shape the size and efficiency of the commercial trucking sector. Adopting a proactive approach will empower companies to adapt and thrive in this evolving landscape.