The commercial trucking industry plays a pivotal role in the U.S. economy, with a fleet exceeding 16 million vehicles. This article explores the state of commercial trucks in the USA, investigating their segmentation into heavy, medium, and light-duty classes. It also examines regional distributions, emphasizing California’s significant share, and evaluates the economic impact of these vehicles on freight and logistics. Through detailed chapters, trucking company owners, fleet managers, and procurement teams can gain holistic insights into understanding how many commercial trucks are operating in the country.
Counting the Backbone of the Road: A Comprehensive Look at the U.S. Commercial Truck Fleet
Behind every delivery window and every freight bill lies a fleet that keeps the American economy moving. The scale of that fleet is easier to imagine when you step back and consider what counts as a commercial truck in the United States, how those counts are gathered, and why the numbers matter for business, policy, and daily life. As of the most recent data available, the total number of commercial trucks in the United States exceeds 16 million. This figure encompasses a broad spectrum of vehicles—from heavy-duty rigs that haul across states to smaller, workhorse trucks that support local deliveries, construction, and service industries. The sheer size of this fleet speaks to the country’s vast freight demands, geographic diversity, and the logistical complexity that underpins everything from consumer goods to infrastructure projects. The United States remains among the world’s largest commercial truck cohorts, a reflection of a freight economy that is both expansive and deeply regional in character. Within this large landscape, California stands out, not simply because it is populous but because it hosts the nation’s largest concentration of trucks in a single state. The figure is striking: well over 1.6 million trucks operate in California, making it the epicenter of truck activity and serving as a bellwether for how traffic patterns, demand for maintenance, and regulatory priorities play out across the country. This concentration underscores a wider point about fleet size: a few states account for a disproportionate share of the nation’s trucks, even as the fleet stretches from the Atlantic to the Pacific, from the Gulf Coast to the Great Plains, and beyond. The distribution is not merely a function of population. It tracks commerce hubs, ports, intermodal facilities, and the sprawling logistics networks that connect manufacturing regions with consumers and customers. At the same time, another layer of nuance sits behind the headline numbers. Heavy-duty trucks—those in classes 7 and 8 that dominate long-haul freight and bulk shipments—represent a meaningful but relatively small slice of the total, roughly about 10 percent. That 10 percent translates into about 1.6 million heavy-duty units within the 16 million total, illustrating how a minority of trucks carry a disproportionate share of weight and distance traveled. The remainder comprises medium- and light-duty trucks, which, while more numerous, tend to operate closer to home, in urban and suburban corridors, and in fleets that emphasize delivery speed, accessibility, and versatility. The numbers themselves come from a combination of industry intelligence and government data. Industry reports and transportation intelligence platforms, such as FTR Transportation Intelligence, have long provided a lens into the fleet’s composition, age structure, and turnover. These sources complement the more formal statistics produced by the U.S. Department of Transportation and its agencies, which track registrations, violations, and vehicle classifications to build a national picture of the rolling inventory on U.S. roads. To understand the landscape in a more granular way, it helps to separate the ideas of a total fleet, a registered fleet, and an operating fleet. The most widely cited total—exceeding 16 million—captures every commercial vehicle that could be deployed in the freight economy, regardless of current usage or the status of particular registrations. The registered count, which hovers around the mid-teens in millions, comes from the annual tallies of vehicles legally registered to operate on public roads. There is a meaningful difference between these two concepts: a vehicle may be registered, yet temporarily out of service, awaiting maintenance, or retired from active use but still on the books. The registered figure of nearly 14 million trucks as of 2023, within the United States, highlights the scale of the fleet that is legally authorized to be on the road under normal operating conditions. These dynamics are not abstract. They influence fleet management decisions, regulatory planning, and investment in infrastructure. When a business evaluates capacity, it looks at how many trucks are available at peak times, how quickly they can be replaced or upgraded, and how resilient the fleet is to disruptions. When policymakers assess roadway wear, congestion, and safety risks, they need to know how many machines share the highways, how many are of a particular class, and where they cluster geographically. The data also reflect the evolution of the fleet over time. The U.S. trucking industry continually absorbs new vehicles, retires older ones, and responds to changing demand—whether driven by consumer patterns, fuel prices, or regulatory shifts aimed at emissions and safety. In that sense, the numbers do more than quantify a fleet; they narrate the rhythm of commerce. Reading these figures also requires attention to regional patterns. California’s dominance as a truck hub, for instance, echoes its role in port activity, manufacturing supply chains, and dense logistics networks that stretch across the state’s vast geography. Texas, Florida, New York, and a handful of midwestern states contribute heavily to the national total as well, each with its own mix of urban centers, rural corridors, and industrial corridors that shape truck miles, vehicle age, and maintenance needs. The geography of the fleet intersects with policy in meaningful ways. States differ in regulatory emphasis—emissions standards, weight limits, and inspection regimes, to name a few—so the composition of the fleet and the timing of turnover can reflect both economic incentives and compliance costs. The heavy-duty share, concentrated where long hauls and cross-border freight predominate, interacts with fleet renewal cycles and the economics of retrofit or replacement. All of this points to a fundamental truth: counts matter not only as a snapshot but as a tool for planning. Businesses rely on accurate tallies to forecast demand for maintenance parts, service capacity, and driver recruitment. Government planners use the numbers to gauge infrastructure needs, design safer roadways, and calibrate investment in aging bridges and highways. Analysts who study the sector’s dynamics examine not only the current total but how it shifts with macroeconomic currents, trade policy, and technological change. In recent years, questions about fleet composition have increasingly intersected with a broader conversation about sustainability and efficiency. The rise of intelligent transportation systems, telematics, and alternative powertrains has begun to influence decisions about which trucks to buy, retire, or retrofit. Even as the overall truck count remains high, the mix—how many heavy- versus light- and medium-duty units are on the road, and how many of them are in service at any given moment—carries implications for emissions, energy use, and air quality. The numbers also invite a practical reckoning for anyone tracking the supply chain’s resilience. A fleet of this size supports countless jobs, from drivers and mechanics to dispatchers and depot managers. It also means a vast ecosystem of suppliers, maintenance facilities, and training institutions that keep the wheels turning. The story behind the numbers is not a static ledger; it is a living, evolving map that reflects the nation’s economic health, regulatory environment, and emerging technologies. For readers who want to dig deeper into state-by-state breakdowns and vehicle types, the National Highway Traffic Safety Administration (NHTSA) maintains a comprehensive, government-verified database of vehicle registrations. This resource provides nationwide statistics as well as state-specific breakdowns by vehicle type and class, offering a solid baseline for any analysis of how many commercial trucks there truly are and how they are distributed across the United States. The interaction of these data sources—industry intelligence, federal registrations, and real-world operational insights—helps explain why different numbers appear in different contexts. The headline figure of more than 16 million commercial trucks signals scale, while the 14 million registered trucks in 2023 signals a more precise frame for current road-ready capacity. Together, they tell a story of a freight economy that is large, regional, and continually renewing itself as fleets age out and new units enter service. As you consider the implications of these counts, it is useful to connect the thread to the practical realities of fleet management and market trends. For instance, the used-truck segment often responds to shifts in depreciation, maintenance costs, and demand for reliability—factors that can be observed in ongoing market analyses and industry commentary. If you are exploring how the fleet’s size translates into opportunity or risk, you may want to examine the evolving landscape of used-truck supply and pricing, which is frequently discussed in industry-focused volumes and market analyses. For a concise snapshot of how the market is adapting to these dynamics, readers can explore the analysis on current trends in used-truck sales growth. Current trends in used-truck sales growth. This piece synthesizes how buyers, sellers, and fleets respond to shifting demand, aging assets, and the balance between supply and demand in a way that complements the raw fleet counts with a practical, human perspective on risk and opportunity. To anchor this discussion in authoritative, nationwide statistics, the U.S. government maintains a central resource that tracks registrations and vehicle types. The National Highway Traffic Safety Administration’s vehicle registration statistics remain the most authoritative government source for understanding how many trucks are registered by state and by vehicle type, providing a clear baseline for policy development, transportation planning, and industry analysis. For researchers and practitioners seeking the official, up-to-date counts that ground these conversations, the NHTSA database is the go-to reference point. External reference: https://www.nhtsa.gov/vehicle-registration-statistics
Tallying the Vast Fleet: How Heavy-, Medium-, and Light-Duty Trucks Shape the U.S. Commercial Vehicle Landscape
The question of how many commercial trucks operate in the United States is more than a simple headcount. It is a lens on the country’s economy, logistics backbone, and the evolving balance between long-haul efficiency, urban delivery speed, and local service needs. As of the most recent data available, the total number of commercial trucks in the United States exceeds 16 million. This is not a uniform mass but a layered forest of machines, each size class optimized for a distinct kind of work. Heavy-duty tractors and their fellow travelers handle the long miles and demanding loads; medium-duty trucks carve out the work in metropolitan regions and regional networks; light-duty trucks, vans, and pickups stitch together the daily fabric of small-business logistics and neighborhood service. Together they form a fleet that keeps supply chains moving, construction sites bustling, and consumers receiving goods with ever-shorter lead times. The breadth of this fleet, and the way it is distributed, tells a story about where American commerce is headed and how policy, market forces, and technology fold into the choices fleets make every year.
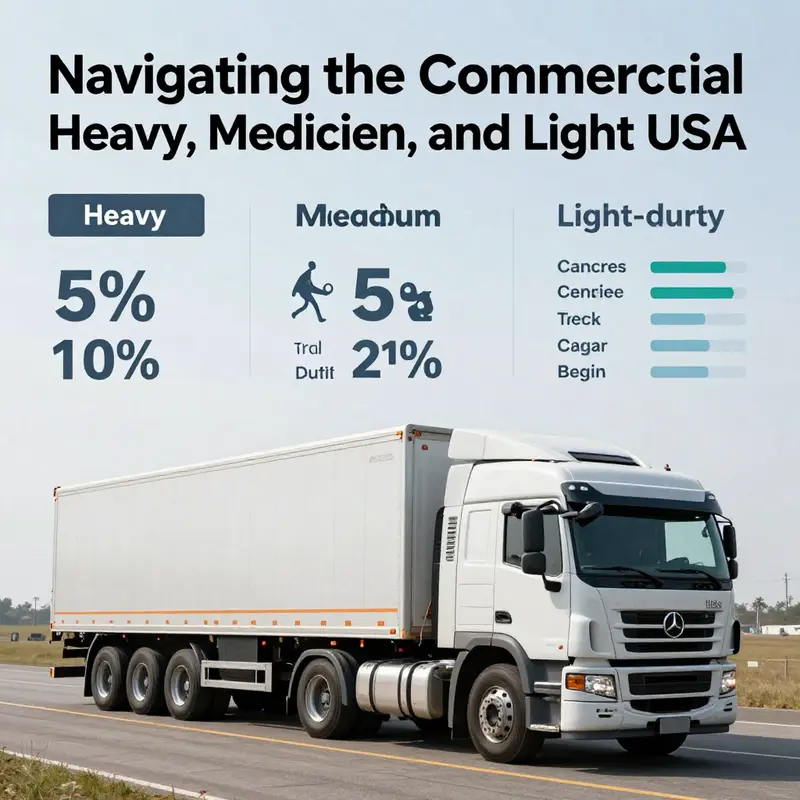
The sources behind these numbers place the United States among the world’s largest commercial truck fleets. The overall figure—more than 16 million—encompasses every weight class, every use case, and every state. Within that total, heavy-duty trucks (typically those with a GVWR of 26,001 pounds or more) constitute a key segment, even if they represent a minority by volume. In many analyses, heavy-duty trucks account for roughly 10% of the total fleet. That proportion underscores how much of the national freight footprint relies on machines built to endure vast distances, harsh loading cycles, and the rugged demands of construction, mining, and large-scale distribution. The rest is filled by medium- and light-duty trucks, whose sheer numbers reflect a different core function: moving goods quickly through urban corridors, performing regional deliveries, or serving municipal needs that require nimbleness and efficiency at smaller scales. California, with its sprawling economy and dense urban centers, embodies this dynamic more vividly than any other state. The state’s fleet surpasses many nations’ truck counts, with over 1.6 million trucks forming the largest concentration in the country. This regional concentration matters because it amplifies the interaction between state policy, infrastructure capacity, and fleet logistics, illustrating how geography and industry mix together to shape the national picture.
To understand the composition more deeply, it helps to parse the market by weight and intended use. Heavy-duty trucks, defined as GVWR 26,001 pounds and above, are the drums of the freight band. They are the tractors that pull the long-haul trailers across interstates, the dump trucks that move soil and aggregate on construction sites, and the refuse haulers that keep urban areas clean. These vehicles demand significant power and durability. Their operations hinge on high payloads, long operating hours, and the ability to sustain performance across miles and seasons. The intensity of their use often translates into higher maintenance costs and longer capital recovery periods, but their capacity to move large quantities of goods makes them indispensable to national and regional supply chains.
Medium-duty trucks fill a complementary niche that bridges the gap between the long-range heavy-haul work and the city-focused light-duty tasks. Ranging from 14,001 to 26,000 pounds GVWR, they are the workhorses of regional distribution, utility services, and municipal fleets. They enable last-mile and regional deliveries with better maneuverability and lower operating costs than their heavier counterparts. Medium-duty platforms are increasingly diversified in propulsion and configuration, driven by urban logistics needs and a growing interest in alternative propulsion systems. The urbanizing economy, with its tight delivery windows and dense traffic, has spurred a shift toward efficiency and reliability in this segment. Fleets that operate medium-duty trucks often balance payload capacity with lifecycle costs, opting for models and configurations that optimize fuel economy, maintenance intervals, and uptime in congested environments. The trend toward electrification or hybridization in this space reflects both environmental concerns and the practical demands of city routes where charging or fueling opportunities are distributed across a network of depots, hubs, and service centers.
Light-duty trucks, defined as GVWR up to 14,000 pounds, account for the majority of the fleet by sheer headcount. They dominate local deliveries, service vans, and a wide array of small business operations. In this segment, versatility, ease of maintenance, and lower upfront costs translate into high adoption rates. The light-duty class includes the familiar pickup trucks and cargo vans that recipients rely on for everything from appliance deliveries to tradespeople visiting job sites. While a single light-duty vehicle carries less payload than a heavy- or medium-duty counterpart, the cumulative impact of tens of thousands of these trucks in metropolitan areas is substantial. They enable rapid, door-to-door service and play a critical role in the efficiency of e-commerce and same-day fulfillment. The market dynamics in this space are shaped by operating costs, residual values, and the flexibility to adapt to shifting urban logistics models.
Understanding the distribution across heavy, medium, and light-duty segments also helps explain regional variations and the implications for infrastructure. The heavy-duty share tends to cluster where freight corridors are most active and where industries such as manufacturing, warehousing, and construction demand robust long-haul capacity. The medium-duty segment tends to thrive in and around cities, ports, and regional distribution hubs, where the need for reliable regional transport and urban service duties is highest. Light-duty fleets proliferate in dense urban and suburban landscapes and across small- to mid-size businesses that prioritize speed and flexibility over raw payload. Taken together, these dynamics illuminate why state and federal transportation planning must account for a spectrum of vehicle types and operational profiles, not just the headline total.
The data behind these conclusions come from a synthesis of industry reports and transportation intelligence platforms, including the work of FTR Transportation Intelligence and the U.S. Department of Transportation. They reflect registrations, registrations in use, and broader fleet estimates that capture variations in how fleets are counted and categorized. While the headline total provides a useful compass, the true story unfolds in the details: how many tractors versus straight trucks, how many regional delivery vans, how many service fleets that rely on smaller chassis, and how many municipal vehicles kept busy on utility and public works routes. The dispersion of these trucks is not static; it shifts with economic cycles, technological progress, and policy priorities. When the market leans toward longer routes and larger loads, heavy-duty capacity expands its dominance; when urban e-commerce and last-mile efficiency take center stage, medium- and light-duty fleets grow in number and sophistication.
A closer look at regional patterns highlights the importance of geography in fleet composition. California’s scale is a case study in how climate, population density, and a mature logistics ecosystem magnify the demand for trucks of all sizes. The state’s large distribution networks, high consumption levels, and the need to move goods to and from dense metropolitan corridors drive a high concentration of both heavy- and light-duty vehicles. Yet the broader national picture still matters, because trucks cross state lines and leverage national freight corridors. Interstate logistics, cross-border supply chains, and national manufacturers depend on a diverse fleet that can adapt to varied terrain, regulations, and market demands. The upshot is that any discussion about the U.S. truck fleet must consider not only the total but also how the fleet is segmented and where the work happens.
What do these segmentation patterns mean for decision-makers inside fleets, policy circles, and the broader economy? For fleets, the breakdown guides procurement and maintenance strategies. Heavy-duty units represent long-term capital commitments with extended lifecycles and higher operating costs. Medium-duty units offer flexibility for regional routes and urban services, where reliability and uptime are paramount. Light-duty units drive the front lines of local deliveries, service calls, and last-mile fulfillment. Fleet managers weigh total cost of ownership, duty cycles, maintenance intervals, and residual values when choosing a mix that aligns with service level agreements and market demand. For policymakers, the segmentation underscores the need for infrastructure that supports a wide range of vehicle types and operating patterns. Road and bridge wear, traffic safety, and emissions policies must reflect the realities of both the heavy-duty corridors and the dense urban grids where light- and medium-duty trucks operate most intensively. And for the broader economy, the aggregated strength and efficiency of this fleet—its ability to move goods quickly, safely, and sustainably—are a barometer of competitiveness, job creation, and consumer confidence.
In this context, the nationwide figure of approximately 16 million trucks represents more than a number. It embodies a system in which each segment serves a distinct function, yet all contribute to a cohesive, though complex, logistics machine. The balance among heavy, medium, and light-duty trucks hints at evolving priorities: longer-range freight efficiency, urban delivery acceleration, and the practical realities of small-business mobility. As e-commerce and manufacturing digitalize further, fleets may shift toward a more nuanced combination of propulsion technologies within these segments, with medium- and light-duty fleets leading the way in urban electrification where charging networks and maintenance ecosystems are more readily integrated into daily operations.
For readers seeking a broader view of how macro shifts influence fleet decisions across these segments, ongoing market analyses and strategic outlooks provide useful context. See the discussion on navigating economic uncertainties and how fleets adapt within both Canadian and U.S. markets, which sheds light on shared challenges and opportunities across North American logistics. navigating-economic-uncertainties-key-insights-from-the-canadian-and-us-trucking-markets/
The numbers, the segments, and the regional patterns together illuminate a nation that relies on a spectrum of purpose-built trucks to keep commerce moving. They reinforce the idea that no single figure can capture the full story of the U.S. trucking landscape. Instead, it is the composition—the heavy‑duty core for freight, the versatile medium‑duty layer for regional and urban work, and the broad base of light‑duty vehicles that touch everyday life—that reveals the health, tensions, and direction of the American economy. This layered understanding helps explain not only how many trucks there are, but why they exist in the forms they do, and how they will continue to evolve as markets, cities, and technologies push the fleet in new directions.
External resource for further context: https://www.researchandmarkets.com/reports/578920/global-medium-and-heavy-duty-commercial-vehicles-market-report
Shifting Lanes: California’s Port-Driven Pulse and the Regional Footprint of U.S. Commercial Trucks
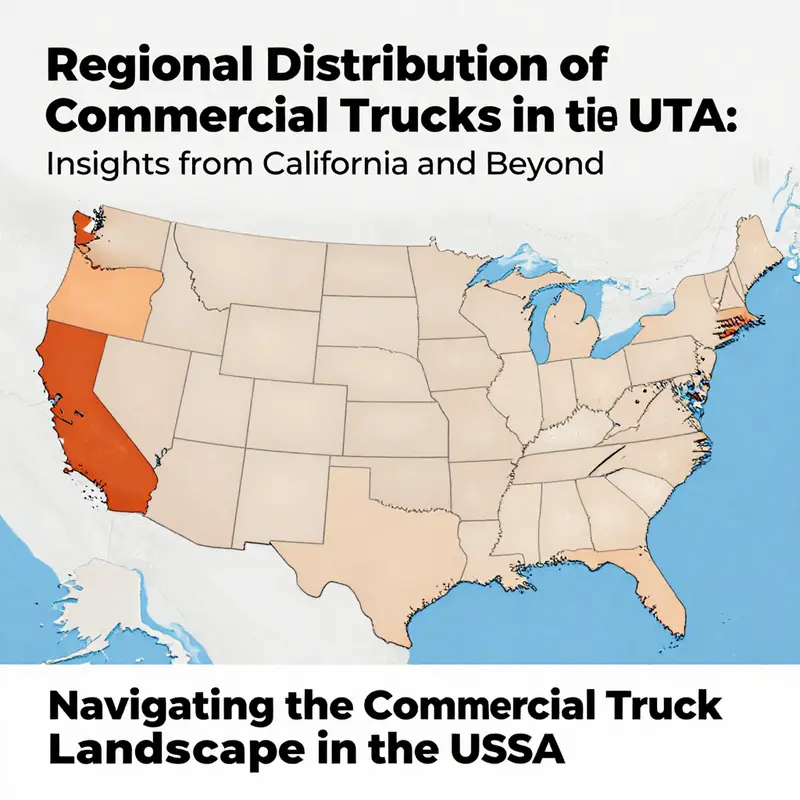
The fleet of commercial trucks that moves the United States is vast, multifaceted, and deeply regional. As of the latest measurements, the total count exceeds 16 million vehicles across all classes and uses, with heavy-duty trucks—those built for long-haul and multistate freight—representing a meaningful yet specific slice of that total. Within that landscape, California stands out not merely as one state but as a powerful logistical engine. Its more than 1.6 million trucks, the largest concentration in the nation, underscores how geography, trade patterns, and policy converge to shape regional distribution. The footprint of the national fleet is not uniformly spread; rather, it forms a web of hubs and corridors where infrastructure, commerce, and regulation interact to orient fleets toward particular urban centers and intermodal gateways. In this light, California’s ports, long a focal point of international trade, reverberate through the entire country’s trucking ecosystem, influencing fleet composition, deployment strategies, and the tempo of regional distribution from coast to coast.
The triad of Los Angeles, Houston, and Chicago emerges as the most influential nodal points in the United States’ commercial-vehicle network. Each city sits at the intersection of substantial port activity, dense highway networks, and expansive warehousing capacity. Los Angeles, with its adjacent port complex, is a primary entry and processing zone for goods arriving from overseas. The logistics choreography around the Port of Los Angeles and the Port of Long Beach is a testament to how modern supply chains rely on rapid container movement, complex interchanges, and drayage operations that shuttle goods from ships to inland distribution centers. That drayage demand, in turn, sustains a high volume of medium- and heavy-duty trucks that are optimized for quick-turn logistics cycles, cleanly illustrating how regional centers translate into national reach. The same logic applies, in different scales, to Houston and Chicago, where intermodal connections, rail corridors, and metropolitan density create enduring demand for fleets tailored to regional distribution and last-mile fulfillment.
California’s dominance, however, is not simply a matter of volume. The state’s regulatory environment, especially on emissions, actively reshapes fleet composition. California’s stringent standards accelerate the adoption of zero-emission technologies and fuel-efficient powertrains, particularly in urban and port-adjacent operations. Fleets operating in Southern California are increasingly layered with alternative-fuel vehicles and electrified powertrains aimed at meeting both regulatory deadlines and operational needs. This transition influences not only the type of trucks in service but also the way fleets plan maintenance, charging or fueling infrastructure, and total-cost-of-ownership calculations. The consequence is a dynamic regional market where buyers weigh environmental compliance alongside reliability, uptime, and residual value.
Yet California is not an island of regulation without economic tethering. The state’s position within the interwoven cross-border economy means that regional distribution patterns extend beyond state lines. Southern California’s port activity creates a steady flow of equipment demand into neighboring states and into broader national supply chains. In this sense, the regional distribution of commercial trucks mirrors a national rhythm—clusters of activity around ports, logistics parks, and major interstate corridors. These clusters are not static; they evolve as infrastructure expands, as new logistics hubs emerge, and as technology reshapes how fleets are managed. The result is a pattern where the heaviest activity concentrates in a few pivotal regions, but the effects ripple widely, affecting depreciation curves for used trucks, pricing for fleet replacements, and the availability of suitable equipment for regional operators.
Beyond California, other states such as Illinois, Ohio, and Michigan play indispensable roles in the broader ecosystem. Illinois anchors a central freight corridor that links the Midwest’s industrial heartland with both coasts and the Canadian market. Ohio sits along key cross-country routes and houses a robust aftermarket and used-truck ecosystem, thanks to its proximity to major OEM assembly facilities and a dense network of dealers and end users. Michigan’s automotive heritage further reinforces a strong demand base for medium- and heavy-duty trucks, especially as fleets retrofit or refresh to accommodate evolving fleets and new business models. This triad of states supports a robust secondary market for used commercial trucks, offering fleets a steady supply of well-maintained equipment and providing buyers with options that match midwestern logistics demands across a spectrum of regional routes. The clustering effect is more than economic efficiency; it is a practical advantage for fleets seeking reliability, serviceability, and predictable maintenance histories—three factors highly valued by B2B buyers navigating the capital-intensive world of fleet procurement.
From an economic standpoint, regional clustering reduces friction in the used-truck marketplace. Operators find that proximity to core regions—where fleets are regularly rotated, retired, or sold—yields access to vehicles with documented performance, service records, and known maintenance histories. The migration patterns of trucks—from high-volume ports or metropolitan hubs to inland distribution cells—create a natural recycling loop. This loop supports a steady cadence of demand for both mid-range trucks and workhorse heavy-duty units, a cadence that is particularly pronounced in the Midwest and West Coast corridors where intermodal activity remains intense. Fleet managers in these geographies can time replacements to align with the seasonal shipping peaks, tax incentives, and depreciation cycles that philosophers of logistics often observe as the underpinnings of regional market liquidity. For fleet owners and their procurement teams, this translates into practical strategies: source locally when possible to minimize downtime and maximize uptime, rely on well-documented fleets for reliability, and balance new-vehicle purchases with high-quality used-truck acquisitions to maintain service levels without destabilizing cash flow.
Technology integration plays a central role in how regional fleets operate. Telematics, fleet-management systems, and data analytics have moved from luxury features to operational necessities. In this shift, California’s fleet managers often lead the way in deploying real-time tracking, engine- and emission-monitoring, and route optimization across port-connected corridors. These systems help ensure compliance with increasingly stringent environmental standards while improving delivery reliability. The same technology enables cross-regional coordination, allowing a Chicago-based distribution hub to anticipate surges in demand from West Coast imports or Northeast consumer patterns, and to dispatch equipment accordingly. The result is a more agile, information-driven network where trucks are allocated with precision to minimize empty miles, shrink dwell times at warehouses, and stabilize lead times for critical goods. It is no accident that the most active regions—California, Illinois, Ohio, and Michigan—also host vibrant fleets of used trucks, where knowledge of vehicle history, maintenance quality, and uptime performance is a strong differentiator in a competitive tender process.
For readers tracking shifts in demand and the evolving landscape of used-truck values, the regional picture matters as much as the national totals. The consolidation of fleets near central hubs creates predictable pressure on vehicle turnover, which in turn affects pricing, availability, and financing terms. It is common to observe a steady flow of pre-owned medium- and heavy-duty trucks moving through Illinois, Ohio, and Michigan while California continues to balance imports with a growing share of domestically sourced, emission-compliant units. This balance influences pricing curves and residual values, especially as fleets modernize with zero-emission options and as residuals for older, higher-emission models respond to policy constraints. In the broader context, the regional dynamics described here connect to the ongoing dialogue about how best to allocate capital, manage risk, and design maintenance programs that ensure uptime across the network.
The regional distribution story is not a static map but a living framework. It informs how fleets plan for the next five to ten years, how dealers price and stock used trucks, and how policymakers assess the balance between economic growth and environmental stewardship. For practitioners and scholars alike, understanding that California’s influence radiates through the country helps explain why certain regions retain stronger used-truck ecosystems while others pivot toward new-vehicle acquisitions or electrified fleets. As the market evolves, the central challenge remains clear: how to sustain reliable, compliant, and efficient trucking networks in a country whose geography inherently invites both specialization and interdependence. To appreciate that complexity is to recognize that the regional distribution of commercial trucks is more than a locator map; it is the backbone of modern freight, a durable indicator of economic health, and a bellwether for the technology and policy choices shaping the industry.
For readers seeking a deeper dive into how the used-truck segment has responded to these regional realities, a related discussion can be found in the broader market analysis at the source level. Read more on recent shifts in used-truck demand and pricing trends in the linked piece: current trends in used-truck sales growth. This resource complements the regional narrative by highlighting how fleet managers across these hubs navigate turnover cycles, capital budgeting, and the balance between new and used equipment as they respond to regulatory and market signals. The interconnectedness of regional dynamics and fleet strategy becomes especially evident when considering how cities like Los Angeles influence the supply of equipment in neighboring states and how Midwest markets absorb surplus or aging units after periods of intense port throughput and intermodal activity. The practical upshot is clear: regional intelligence matters for anyone buying, selling, or managing fleets that span multiple regions and demand profiles.
As a final note, the broader market context that frames these regional patterns is captured in the latest industry outlook. A comprehensive external resource offers deeper insight into the long-term trajectory of U.S. commercial vehicles, including policy, technology, and macroeconomic factors that shape fleet decisions well into the next decade: https://www.researchandmarkets.com/reports/654321/us-commercial-vehicles-market-outlook-to-2030. This external reference situates the regional discussion within a national framework, helping readers connect the dots between what happens at ports and warehouses in Southern California and the procurement desks in the Midwest and beyond.
Counting the Kilometers of Commerce: The Economic Backbone of U.S. Freight and Logistics
Few sectors shape the texture of daily life as directly as freight moving along American roads. If one were to tally the nation’s commercial fleet by counting the machines that shoulder the heavy lifting of production and consumption, the number would hover above sixteen million. This figure, though immense, still belies the complexity of the system it represents: a sprawling, multi-state web of carriers, drivers, yards, and warehouses that together convert raw materials into shelves, and shelves into communities. Within this vast fleet, a significant subset—heavy-duty trucks in classes 7 and 8—accounts for roughly one-sixth of the total. That proportion translates to about 1.6 million heavy trucks nationwide, a fleet size that underscores both the scale of U.S. commerce and the unique logistical challenges that accompany operations of that magnitude. California’s fleet clout is especially notable; the state holds more than 1.6 million trucks, illustrating how regional concentrations reflect trade corridors, urban demand, and the density of manufacturing and distribution activity that concentrates on the West Coast and its ports. These numbers, grounded in industry reporting and transportation intelligence, provide a baseline for understanding not just how much is on the road, but how that roadwork interacts with the broader economy, the environment, and policy choices that shape efficiency, costs, and resilience.
Even at a glance, the fleet’s composition clarifies a central truth about American logistics: trucking dominates the movement of freight by weight. On average, trucks transport more than 70 percent of all freight by weight in the United States, a staggering share that places trucking at the heart of supply chains that feed manufacturers, retailers, and consumers. This dominance is not simply a matter of capacity; it is a reflection of the just-in-time mindset that has become a standard operating rhythm for many industries. When a factory turns out a component, it expects that component to arrive at the next stage of production within a tightly orchestrated time window. When a retailer restocks, it relies on dependable freight movement to avoid shortages. In both cases, the truck is the conduit that makes the rhythm possible. The result is a system where efficiency begets efficiency: when freight moves smoothly, production costs shrink, inventories are leaner, and economic productivity climbs. The trucking sector thereby acts as a multiplier for growth, enabling manufacturers to scale, retailers to optimize, and consumers to access a consistent flow of goods.
The economic case for trucking goes beyond the movement of freight itself. Employment opportunities flow through the sector in direct and indirect channels, from drivers and dock workers to fleet managers, mechanics, and warehouse staff. But the impact radiates further still: the efficiency of freight movement influences plant operations, supplier schedules, and retail pricing. When truck productivity rises—whether through better route planning, more reliable equipment, or smarter loading practices—manufacturers can reduce capital tied up in raw materials and in-process inventory. Retailers can reduce buffer stock while maintaining service levels. In short, every improvement in truck logistics reverberates through the supply chain, lifting productivity and supporting wage growth and investment in adjacent sectors. The broader economy benefits when trucking keeps goods moving with reliability and speed, even as demand cycles fluctuate across seasons and regions.
Yet the same scale that delivers economic benefits also presents environmental and policy challenges that cannot be ignored. The growth of trucking operations has contributed to rising tailpipe CO2 emissions, a dynamic shaped by the fuel intensity of heavy-duty vehicles and the evolving efficiency of engines and aerodynamics. As the data suggest, heavy trucks have accounted for more than eighty percent of the increase in emissions since 2000. That trajectory is a reminder that the freight system, while central to growth, also imposes environmental costs that communities experience in air quality, climate implications, and local health outcomes. The regulatory response to these realities has become a central axis of ongoing debates about how to reduce emissions without undercutting the efficiency and reliability that trucking provides to the economy. It is not simply a matter of setting standards; it is also about rethinking how freight moves through the network—how goods are loaded, routed, and scheduled, and how fleets are renewed with cleaner technologies and smarter logistics practices.
What emerges from these realities is a picture of a sector in constant negotiation: the need to lift the economy while steering the environmental footprint downward, to maintain throughput as the supply chain absorbs shocks, and to adapt to a landscape in which fuel costs, capital expenditure, and policy incentives all influence fleet decisions. The question of how many commercial trucks exist in the United States is not merely a count; it is a lens into how the economy organizes itself around movement. The fleet’s size signals the scale of opportunity for fleet modernization programs, the potential for technology to compress costs, and the urgency of workforce development to sustain a growing, aging, and increasingly regulated industry. For readers who follow the ebb and flow of truck utilization, the number also hints at market dynamics—how many assets are available, how many drivers are on the road, and how fleets balance utilization with maintenance, compliance, and depreciation.
In examining the current landscape, it is worth acknowledging that a meaningful share of this fleet operates across a few critical corridors and hubs. California’s expansive truck presence reflects its role as a major gateway for international trade and a dense consumer market that sustains continuous freight activity. Yet the national footprint stretches from the Gulf Coast manufacturing belts to the Pacific Northwest’s distribution networks, to Midwest corridors that connect farming, refining, and assembly with national retail and export channels. The geography of trucking, therefore, mirrors both demand centers—where goods are created and consumed—and the infrastructure that supports movement, including road networks, intermodal facilities, and warehousing capacity. The result is a system that thrives on scale, yet remains sensitive to localized conditions—from port congestion to weather disruptions, from regional fuel prices to state and local regulations.
From a management perspective, this scale creates both a set of opportunities and a set of risks. Efficient freight movement hinges on asset utilization, route optimization, and maintenance practices that extend the life of a vehicle while reducing unscheduled downtime. The aging profile of many fleets—driven by capital constraints, residual value considerations, and shifts in demand—means that many trucks operate closer to their service windows than they did in earlier years. That reality has tangible implications: fleets invest more in telematics, predictive maintenance, and driver training to avert costly breakdowns, and they pace capital expenditures to balance the need for newer, cleaner, and more efficient equipment with the realities of procurement budgets and financing conditions. In other words, the sheer volume of trucks on the road amplifies both the potential gains from smarter management and the consequences of inefficiency or delay. The result is a sector that continuously recalibrates its operating model to sustain throughput while easing the environmental and societal costs that inevitably accompany heavy freight movement.
For readers who track the intersection of trucks, markets, and policy, the data on fleet size also illuminates demand signals that influence pricing, capacity, and resilience. A larger fleet tends to align with greater market capacity, which can moderate price volatility and improve service reliability. Conversely, when demand surges or supply chains tighten, the same vast fleet can become a buffer that keeps goods flowing, though at higher marginal costs and potential congestion in chokepoints like urban corridors and port neighborhoods. The dynamic is not purely about headcounts; it is about how those headcounts translate into miles traveled, loads carried, and the speed with which goods reach their destinations. In a connected economy, the numbers on the fleet are, in essence, the heartbeat of trade—visible proof that freight is moving, albeit with the tensions and tradeoffs that accompany any large, distributed system.
The environmental dimension cannot be abstracted away. The sector’s emissions profile has become a focal point for policymakers, industry leaders, and communities alike. The trend toward cleaner propulsion, greater fuel efficiency, and smarter logistics has the potential to reshape the cost structure of freight and to alter the tempo of economic activity. Investments in cleaner technologies, alongside operational innovations such as load optimization, congestion management, and routing efficiency, promise not only lower emissions but also lower total costs of ownership over the life of a fleet. The economic argument for such investments is reinforced by the fact that fuel costs, maintenance, and compliance represent substantial ongoing expenses for fleets. Reducing emissions and improving efficiency can yield measurable savings over time, even as upfront capital costs for newer technologies are amortized. In this sense, environmental and economic goals are not at odds but are intertwined parts of a shared objective: maintaining reliable, affordable freight while reducing the environmental externalities that accompany heavy trucking.
As readers explore this landscape, linking the macro picture of fleet size and regional distribution with the micro realities of fleet management and emissions clarifies why the number of commercial trucks matters beyond headline counts. It matters because it anchors a set of decisions that affect capital allocation, workforce development, and regulatory strategy. It matters because it frames the pace and direction of innovation in propulsion, aerodynamics, and data-enabled operations. And it matters because it situates trucking within a broader economy that demands efficiency, resilience, and sustainable growth. To those charting the path forward, the total truck population isn’t a static stat; it is a living descriptor of how the United States moves, balances, and optimizes the continuous flow of goods that define contemporary life. For anyone seeking to understand the pulse of freight, the number is a starting point, not a conclusion—an invitation to look deeper into the ways that millions of vehicles, miles of road, and a web of supply chain actors converge to keep the nation stocked, productive, and interconnected.
For a practical sense of how market dynamics are shifting within the used-truck segment—an important counterpoint to the larger fleet size and its age structure—readers may find valuable insight in current analyses of used-truck demand and pricing trends. This evolving submarket reflects how fleets balance upfront capital with ongoing operating costs, and it often serves as a gauge of overall fleet health and financing conditions. The ongoing dialogue in this space helps explain why decision-makers pay attention to resale values, maintenance costs, and the availability of replacements as they manage fleets that total in the millions of units.
In sum, the United States hosts a fleet that is not just large but deeply influential. Its size signals the scale at which logistics, manufacturing, and consumer activity unfold, while its composition and regional distribution reveal where demand flows and where policy can drive meaningful improvements in efficiency and emissions. The number of commercial trucks is a lens on the economy’s arteries: it shows how goods move, how jobs are created, and how innovations in technology and practice can bend the curve toward a more productive and cleaner future. For practitioners, policymakers, and observers alike, that count is less a static tally than a dynamic, performance-related metric—one that will continue to evolve as engines become cleaner, fleets become smarter, and the movement of goods becomes ever more integrated with digital optimization and environmental stewardship.
External resource: https://www.epa.gov/air-emissions-inventory/2023-transportation-sector-emissions
Final thoughts
Summarizing the intricate role of commercial trucks in the U.S., we see that their numbers, segmentation, and regional distribution shape the logistics landscape profoundly. With over 16 million trucks operating, this industry not only propels the economy but also connects the nation in ways fundamental to commerce. Understanding these dynamics equips stakeholders in the trucking industry to make informed decisions and adapt strategies to harness the capabilities of this vital fleet.