The United States boasts one of the largest commercial truck fleets globally, with about 4.3 million trucks integral to various sectors, including logistics, construction, and freight transport. The diverse types such as heavy-duty, medium-duty, and delivery trucks collectively shape the economic and transport infrastructure of the country. This article aims to dissect how many commercial trucks exist in the U.S., highlighting the statistics, economic implications, regulatory frameworks, and technological advancements influencing the industry. Each chapter builds upon the next, providing a comprehensive overview of the role that commercial trucking plays in the contemporary economy.
Counting the Fleet: A Detailed Look at the Size and Composition of the U.S. Commercial Truck Population

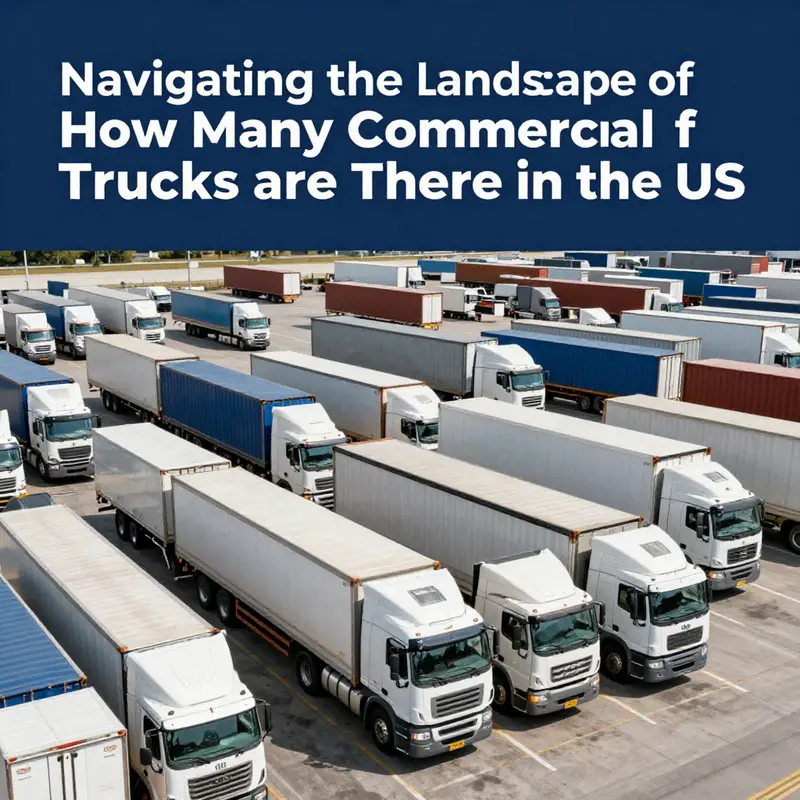
The United States relies on a vast and varied commercial truck fleet to move goods, support construction, and keep supply chains functioning. Recent, authoritative counts place the U.S. commercial truck population at approximately 17.72 million units at the end of 2023. That headline number captures an entire ecosystem: private fleets, commercial carriers, municipal and public-sector vehicles, and the broad mix of heavy, medium, and light-duty trucks and vans that do the daily work of commerce.
Breaking down the total reveals how the fleet is structured. Roughly 17.44 million of those units operate in the private and commercial sectors. These include for-hire carriers, private logistics and distribution fleets, dealer and rental vehicles, and commercial vans used by service businesses. The public sector portion—municipal vehicles, state DOT fleets, and other government-owned trucks—accounts for about 280,010 units. Together, these segments form a stable base that supports trucking’s central economic role. The distribution between private/commercial and public vehicles underscores the predominance of market-driven freight activity versus government-operated transport needs.
Stability masks nuance. While the headline fleet size remained broadly steady, underlying flows tell a more dynamic story. New commercial truck registrations jumped meaningfully in 2023. Over 1.6 million new commercial vehicles (GVW 1–8) were registered that year, a 14% increase over 2022. That rise reflects a recovery in leasing and fleet renewal after prior inventory shortages and supply-chain disruptions. It also signals fleet owners’ responses to demand and regulatory pressures: operators replace older units to improve uptime, meet emissions or safety requirements, and adapt to shifting freight patterns.
The heavy-duty segment—trucks typically used for long-haul freight and large regional loads—remains a crucial component of the fleet, with about 1.5 million heavy-duty units reported in broader industry summaries. Medium-duty trucks, often found in urban and regional delivery, construction, and service roles, make up a significant share as well, estimated at roughly 1.8 million units for certain GVW categories. Light commercial vehicles, including delivery vans and smaller service trucks, fill out the remainder. These categories overlap in real-world usage, as companies deploy a range of GVW classes for last-mile delivery, refrigerated transport, and specialized vocational tasks.
Understanding the composition matters because each segment has different utilization patterns, lifecycle economics, and regulatory drivers. Heavy-duty long-haul tractors operate millions of miles annually and have distinct maintenance and replacement cycles compared with medium-duty box trucks or light-duty delivery vans. Public sector trucks often have lower annual mileage but stricter procurement and disposal policies. Private fleets may move quickly to lease or buy new units during growth periods, while owner-operators balance capital constraints with the need to remain competitive.
Geography and industry mix further shape the fleet. Freight-dense regions, major ports, and manufacturing corridors host large concentrations of heavy and medium trucks. Urban areas show a higher prevalence of light commercial and last-mile delivery vans. Construction-heavy states typically maintain more vocational trucks, such as dump trucks and concrete mixers. These local patterns influence regional markets for used trucks, maintenance services, and parts distribution, and they matter to policymakers designing emissions or safety programs.
Economic and regulatory conditions are the main levers that change fleet numbers over time. Fuel prices, freight demand, and GDP growth influence how many trucks fleets keep or shed. When demand rises, carriers add units or increase driver hours; when demand softens, fleets may delay replacements or sell off surplus vehicles. Regulatory changes—emissions standards, electronic logging device (ELD) mandates, and safety rules—create waves of replacement activity as fleets seek compliant models. In recent years, inventory disruptions from global supply chains and semiconductor shortages constrained new truck deliveries, compressing fleet churn. As those bottlenecks eased in 2023, registration activity rebounded.
Technological shifts also matter. Electrification, for instance, has moved from pilot projects to commercial deployments in specific segments. Electric trucks are more present in urban delivery and short-haul applications where predictable routes and depot charging make economic sense. That adoption is nascent relative to the total fleet, yet it informs purchasing decisions, infrastructure planning, and secondary markets for used trucks. Similarly, telematics and predictive maintenance tools extend vehicle lifespans and change replacement timing. Fleets that extract higher utilization from existing assets may postpone new purchases, softening short-term growth in registered units while raising utilization per truck.
Fleet age and condition are important hidden variables behind the simple count. A large roster of trucks looks different if many units are near retirement versus if they are recently replaced. Aging fleets often increase demand for parts, repair services, and used truck sales; younger fleets drive demand for financing and leasing. The surge in 2023 registrations partly reflects replacement activity, which modernizes the fleet and can improve safety and emissions profiles quickly. This dynamic means that a stable total fleet number can coincide with substantial churn inside the population.
Market consequences ripple beyond operators. Used truck prices, dealer inventories, and auction volumes respond sensitively to fleet composition and registration trends. When new deliveries slow, parks of late-model used trucks thin out and prices can rise, attracting buyers and independent operators. Conversely, strong new-vehicle deliveries push used inventories higher and can depress prices. Financing and leasing markets also adapt; lessors often expand or contract offerings based on residual-value expectations and macroeconomic forecasts.
Policy makers and planners rely on accurate counts and composition detail to design effective transportation and environmental policies. A 17.72 million-unit fleet implies a particular baseline for emissions, road wear, and safety oversight. When regulators consider standards or incentives—accelerating electric truck adoption, tightening emissions limits, or funding charging infrastructure—they need to know where trucks operate and how quickly fleets can realistically turn over. Public sector fleets, while a smaller slice, can serve as early adopters for new technology or pilots for emission-reduction programs.
For businesses and investors, the fleet size offers signals about market health and capacity. A stable, large fleet reflects sustained demand for trucking services and indicates resilience in supply chains. The 14% jump in new registrations in 2023 flagged renewed investment in capacity and suggests operators expected stronger freight volumes or federal and state incentives to refresh equipment. At the same time, macroeconomic uncertainty can temper expansion plans, making registration surges a useful but not definitive indicator of long-term trends.
Operationally, fleet managers watch registrations, scrappage rates, and average vehicle age closely. These metrics help forecast maintenance budgets, capital needs, and crew planning. For example, routes that previously relied on medium-duty units may transition to smaller electric vans as the last-mile market evolves. Planning such transitions requires reliable data on how many trucks of each class are in service and where they operate.
The recent S&P Global Mobility report provides a useful, timely snapshot used widely by industry analysts and planners. It documents both the overall 17.72 million figure and the year-over-year registration increase, framing the 2023 rebound within the broader context of inventory normalization. For readers who want to review the source directly, the S&P research note is available online and outlines the registration trends in more detail (source below).
As fleet dynamics continue to evolve, the raw count of trucks will remain an essential metric. But it is the composition, age profile, and replacement cadence that determine how that number translates into economic activity, emissions, market opportunities, and infrastructure needs. The 17.72 million figure is a snapshot that anchors those deeper conversations and helps stakeholders plan for the next phase of trucking’s evolution.
For more on current market movements and the used-truck side of this equation, see this discussion of broader market trends in used truck sales and fleet behavior: https://mcgrathtrucks.com/current-trends-in-used-truck-sales-growth/.
Source: Standard & Poor’s Global Mobility – “U.S. Commercial Truck Registrations Rise 14% in 2023” (Published March 16, 2024): https://www.spglobal.com/mobility/en/research/insights/u-s-commercial-truck-registrations-rise-14-in-2023
Counting the Backbone: The Economic Weight of America’s Commercial Truck Fleet
The numbers behind how many commercial trucks move through the United States are more than a tally; they map the scale and resilience of the economy. When people ask how many commercial trucks are there in the US, they are probing the capacity of a vast, interconnected system that underpins manufacturing, retail, energy, agriculture, and construction. There are two widely cited measures that illuminate the landscape and they often sit at odds with one another because they capture different things. On one hand there is the count of trucks actively in operation at any moment. On the other there is the stock of registered commercial vehicles that may be sitting idle in storage or awaiting work but are nonetheless counted as part of the fleet. In practical terms this means the fleet is both a live humming workforce and a stored asset that reflects the market s history expectations and policy environment.
Current estimates show a substantial fleet that dwarfs many other segments of road transport. As of the most recent data roughly 4.3 million commercial trucks are described as being in operation. This figure emphasizes active freight movement the daily reality of shippers carriers and drivers who keep goods flowing toward markets warehouses and storefronts. Yet a separate broader lens tells a different story about 11.5 million vehicles are registered in the United States for commercial purposes. These registrations cover all shapes and sizes from tractor trailers that haul long haul freight to delivery vans that punch through urban corridors and smaller freight carrying trucks that service regional needs. The divergence between operational and registered counts is not a contradiction it is a reflection of how fleets are managed maintained and repurposed in response to demand cycles financing arrangements and regulatory frameworks.
From a segment perspective the fleet s composition matters as much as its size. The heavy duty segment with gross vehicle weight ratings typically above 8001 pounds accounts for a substantial share of both activity and capital investment. A rough slice of the data places roughly 1.5 million heavy trucks in operation while the broader heavy truck category remains a workhorse in long haul freight and bulk logistics. Medium duty trucks weighing between 10001 and 14000 pounds number around 1.8 million in the broader registered pool underscoring their role in regional delivery construction and service industries where mid sized capacity is critical. Light duty and delivery trucks fill the remainder driving the bustling last mile that is the backbone of consumer commerce. The distribution is not merely a matter of weight class it reveals how the economy organizes freight the need for volume and range in rural to urban links and the push pull between capacity efficiency and cost.
The economic footprint of this fleet is outsized. The trucking industry supports a large share of U S freight by weight an estimate commonly anchors the figure around 70 percent. That dominance arises not only from the sheer volume of trucks but from the density and reach of road networks across the country. When freight moves primarily by road the trucking sector becomes the central nervous system of the economy translating manufacturing output into consumer access just in time deliveries and regional specialization. The macro impact is tangible the industry contributes on the order of hundreds of billions of dollars to GDP and sustains millions of good paying jobs directly in trucking and indirectly through maintenance financing fuel manufacturing insurance and technology services that support the fleet.
This scale also explains why the trucking industry is closely watched during shifts in policy fuel costs and macroeconomic conditions. The same fleet that moves goods today is continually updated by new registrations retirements and replacements driven by aging equipment and the ever present pressure to improve efficiency and emissions performance. In 2023 for example over 1.6 million new commercial vehicles were registered a rise that signals not just expanding capacity but a willingness to invest in newer technology and safer more efficient operations. As fleets refresh the composition of the fleet quietly tilts toward more capable powertrains better telematics and more productive configurations progress that touches fuel economy maintenance intervals downtime and the reliability of delivery timetables.
The numbers also speak to how fleets adapt to demand dynamics including the surges created by e commerce and the growth of last mile delivery. As shoppers increasingly expect rapid trackable and flexible fulfillment the pressure to maintain robust well maintained fleets intensifies. This can manifest as a strategic shift toward more versatile vehicle types increased utilization of regional hubs or a broader mix of vehicles that can handle varied payloads and route profiles. Fleet operators grapple with balancing upfront costs against long term operational savings choosing between new purchases certified used units and the secondary market options that can stretch capital without compromising reliability. In this arena the decision making process is nuanced strategic and deeply tied to the way a fleet is expected to perform in the face of fluctuating fuel prices driver shortages and evolving emissions regulations.
The interplay between fleet size and infrastructure is another thread that ties the numbers to the national fabric. A large modern fleet demands durable road surfaces efficient border crossings and timely maintenance funding. It also generates steady demand for fuel parts maintenance services and a spectrum of technology solutions that monitor performance optimize routes and reduce downtime. The pace of innovation in this sector has accelerated in recent years as fleets adopt telematics predictive maintenance and advanced safety systems. All of these technologies are anchored in a fleet size that justifies the investment and supports a robust ecosystem of suppliers technicians and service centers. In turn policymakers monitor these trends because they influence highway wear safety outcomes and the efficiency of the broader supply chain.
One practical implication of the fleet s scale is the ongoing importance of data hygiene and fleet analytics. With tens of millions of registered and active vehicles across a diverse set of operators the accuracy and granularity of fleet data become a competitive differentiator. Fleet managers increasingly rely on data to assess total cost of ownership plan for aging assets and time the introduction of new equipment with lifecycle economics in mind. Decisions around sourcing whether to purchase new lease or acquire through auctions are informed by both the price trajectories of used equipment and the availability of high quality risk managed inventory. This is where the real world tradeoffs of fleet growth come into view the intersection of capital efficiency maintenance predictability and the reliability of service that keeps supply chains agile and responsive.
The sourcing question the method by which fleets acquire equipment has its own narrative about how the broader truck population evolves. Operators weigh the comfort of dealer channels against the liquidity and flexibility of the used market and auctions. This is not simply a budgeting choice it is a strategic decision about uptime maintenance standards and the ability to redeploy capacity quickly in response to demand shifts. A practical glance at industry discourse shows how people think about this decision the tradeoffs are familiar new units offer the promise of modern technology longer warranties and known maintenance histories but at a higher upfront cost used and auction market options can deliver lower entry prices and faster fleet expansion but they carry greater risk and sometimes require more intensive inspection reconditioning and ongoing maintenance planning. In the end the choice hinges on the balance between desired reliability total cost of ownership and the pace of change in freight demand.
For readers seeking authoritative data and ongoing updates reference points remain essential. The American Trucking Associations continue to be a primary source for fleet counts and industry trends anchoring the public discourse in a steady stream of research and insights. External readers may also consult updated national data and policy analyses that track how the fleet evolves in response to macroeconomic conditions and regulatory developments. In particular the evolving landscape of emissions standards fuel technology and alternative powertrains is shaping how operators think about fleet renewal residual values and overall capacity planning. As e commerce accelerates the demand for reliable flexible delivery the fleet s size and composition will likely continue to shift in ways that reinforce both resilience and efficiency across the supply chain. For authoritative figures and ongoing updates consult the American Trucking Associations https://www.trucking.org.
Rules, Records, and Reality: How Regulation Shapes the U.S. Commercial Truck Count

Understanding how many commercial trucks operate in the United States means looking beyond a simple tally. The total is not set by a cap or quota. Instead, it is the product of regulations, market forces, safety priorities, and record-keeping systems that together shape fleet size, composition, and movement. This chapter examines the regulatory framework that governs commercial trucks, explains how those rules influence the number and types of trucks on the road, and describes how official counts are produced and interpreted.
At the federal level, the Federal Motor Carrier Safety Administration (FMCSA) is the primary agency setting standards that affect commercial truck operations. The FMCSA’s mandate centers on safety—reducing crashes, injuries, and fatalities involving large trucks and buses—rather than controlling how many vehicles exist. Still, the agency’s rules indirectly affect fleet size. Complex requirements for driver qualifications, hours of service, vehicle maintenance, and financial responsibility raise the cost and administrative burden of operating commercial vehicles. Those costs influence operator decisions about whether to add trucks, retire older units, or shutter routes. When the rules tighten, marginal operations may scale back. When enforcement slackens or compliance costs fall, fleets can expand more easily.
Safety and maintenance standards are foundational. Vehicles must meet inspection and repair requirements that keep them safe for highway use. These standards reduce the number of unsafe trucks in service and encourage the retirement of poorly maintained units. For fleets weighing the economics of continued operation versus replacement, maintenance rules play a role in fleet renewal cycles. Heavy compliance costs—parts, labor, and downtime—make owners more selective about adding trucks. Conversely, advances in diagnostics and telematics can lower long-term maintenance costs and spur growth in truck numbers by improving uptime.
Driver regulations are equally decisive. Commercial drivers must hold the proper licenses and endorsements and meet medical and background standards. The Commercial Driver’s License (CDL) regime establishes minimum skills and credentials for operators of large trucks. Additional endorsements—tankers, hazardous materials, passenger transport—further shape who can operate which vehicles. In recent years, driver shortages have become a limiting factor for fleet expansion. Even when firms can purchase new units, sourcing qualified drivers can delay putting those trucks into service. Rules on entry-level training and drug and alcohol testing influence the pipeline of new drivers and thus the practical capacity of the truck fleet.
Hours-of-service (HOS) regulations directly limit how long drivers can operate before rest is required. These rules are designed to reduce fatigue-related crashes and have a practical effect on how many trucks are needed to move a given volume of freight. Tighter HOS limits require more drivers, or more trucks, to cover the same route density when compared to more permissive rules. Where carriers cannot recruit additional drivers, they may choose to operate fewer trucks or optimize routes. In contrast, exemptions or carrier investments in logistics software can mitigate the impact of HOS constraints and sustain higher truck utilization.
Weight and dimension rules also influence fleet composition. Federal statutes set maximums for gross vehicle weight on the Interstate System, while states regulate axle configurations and bridge formulas. These limits protect infrastructure and shape vehicle design choices. Shippers and carriers often respond by using different truck classes or trailers to maximize payload while remaining compliant. The consequence is that counts by vehicle class—light, medium, heavy—reflect both regulatory boundaries and operational preferences. Some sectors favor heavier, high-capacity rigs; others use smaller trucks to meet urban delivery needs under local restrictions.
Licensing, registration, and insurance requirements make the truck count measurable. Trucks must be registered with state agencies, display proper markings, and carry insurance that meets federal and state mandates. The compilation of registrations forms the backbone of official statistics. Yet, interpreting those figures requires nuance. Registrations indicate the pool of licensed commercial vehicles, but not all registered trucks are active at any given moment. Some sit in storage, some are seasonal, and some are used for non-commercial purposes despite their registration class. As a result, agencies and analysts often refer to operating fleets or active units when discussing the number of commercial trucks on the road.
Enforcement mechanisms translate rules into practice. Roadside inspections, safety audits, and carrier monitoring programs identify noncompliance. Strong enforcement raises the cost of operating noncompliant units and reduces the number of unsafe trucks. Conversely, limited inspection capacity or deferred enforcement can temporarily allow larger numbers of noncompliant trucks to remain operational. Enforcement also affects data quality: thorough inspections produce better records and more reliable counts, while inconsistent oversight can leave gaps in official statistics.
Environmental and emissions regulations are an increasingly important influence. Emissions standards and state-level initiatives encourage the adoption of cleaner engines, after-treatment systems, and, in some cases, alternative powertrains. While these rules do not directly cap truck numbers, they affect decision-making about fleet turnover. Fleets facing stringent emissions rules may retire older diesel trucks sooner and invest in newer, compliant units. That can temporarily boost registrations as replacements are purchased, or it can reduce the active count if some operators exit the market due to conversion costs. Programs and incentives that ease the transition to cleaner vehicles can moderate these impacts and support fleet retention.
State versus federal roles create additional complexity. While the FMCSA sets national safety standards, states manage vehicle registration, driver licensing, and intrastate enforcement. This dual system can lead to variation in how trucks are counted and regulated. A truck may be registered in one state but operate predominantly in another; it may be subject to different inspection rigor depending on where it travels. Harmonizing state and federal data remains a challenge for analysts trying to produce a single, accurate national figure for commercial trucks.
Measuring the fleet relies on multiple data sources. The Bureau of Transportation Statistics compiles registration data, the American Trucking Associations and industry groups publish estimates, and state motor vehicle agencies maintain records. These sources differ in definitions and methodologies. Some counts focus on large trucks—commonly defined as those with a gross vehicle weight rating above 10,000 pounds—while others include medium and light commercial vehicles, such as delivery vans and service trucks. Analysts must reconcile these differences to produce coherent totals. For example, a commonly cited figure of roughly 3.5 million large trucks complements broader estimates that place total commercial truck counts—including light and medium-duty vehicles—around 4.3 million.
Economic conditions and policy changes interact with regulatory effects. When freight demand grows, fleets expand, and new registrations rise. During downturns, operators defer purchases and retirements may outpace additions. Fuel prices, tariffs, and tax incentives can all shift the calculus for buying and operating trucks. Regulatory clarity also matters: predictable rules enable long-term investments, while abrupt policy shifts can cause temporary contraction as operators reassess compliance costs.
Finally, data interpretation matters nearly as much as data collection. Official tallies, operational counts, and industry estimates each tell part of the story. A number such as 3.5 million large trucks is useful, but its meaning depends on definitions: which vehicles are included, whether the count reflects active or registered units, and how seasonal or dormant equipment is treated. For practical planning—whether for infrastructure investment, safety initiatives, or environmental programs—stakeholders need consistent, transparent metrics.
Taken together, regulation shapes not by dictating an upper limit on trucks, but by establishing the safety, operational, and economic boundaries within which fleets grow or shrink. The result is a commercial truck population determined by rules, market forces, and the quality of data systems that record them. For readers seeking deeper context on market trends and the practicalities of buying and selling trucks, the McGrath Trucks blog provides industry perspectives and analyses that complement regulatory insights.
For official and detailed statistics on commercial truck registrations and operations, consult the Bureau of Transportation Statistics: https://www.bts.gov/.
Tallying the American Truck Fleet: How Technology Reveals the Size of the US Commercial Truck Population

Counting the U.S. commercial truck fleet is not a single census but a layered estimate built from multiple data streams. Registration data, active vehicle status, and usage signals from telemetry combine to form a moving picture of capacity. Estimates typically place the fleet around four million trucks, with heavy-duty, medium-duty, and light-duty contributing different shares. This range reflects not just stock but utilization, regional patterns, and seasonal demand. Technological advances in ELDs, telematics, and AI-assisted cross-validation have improved precision by reconciling disparate inputs and identifying gaps in coverage. The practical significance of these counts lies in highway planning, infrastructure investment, and supply-chain resilience. While the exact number ebbs with economic cycles and regulatory changes, the trend toward higher transparency and continuous updating helps policymakers and operators make better decisions. As data-sharing ecosystems mature, the fleet size becomes a probabilistic range rather than a single point, providing a robust basis for capacity planning and policy design.
Final thoughts
In summary, the U.S. commercial trucking landscape is characterized by a robust fleet of approximately 4.3 million trucks that significantly bolster the economy. Through understanding the current statistics, economic impacts, and the evolving regulatory and technological frameworks, stakeholders can better navigate this vital industry. Staying informed about these dynamics is crucial for trucking company owners, fleet managers, and procurement teams in construction and logistics sectors as they adapt to and leverage the capabilities of this indispensable transport infrastructure.